QR Code Statistics 2025 — Key Insights
A summary of QR code scanning, types, demographics, and best practices for small businesses.
1. Scanning Behavior Patterns
| Mobile Dominance |
98% of scans from mobile devices — tablets & others: 2% |
| Peak Scanning Times |
- Lunch (12:00–13:00)28%
- Evening (18:00–20:00)22%
- Afternoon (14:00–17:00)20%
- Morning (8:00–10:00)15%
- Night (21:00–7:00)15%
|
2. QR Code Type Popularity
| Website URL |
45% |
| vCard / Contact |
20% |
| WiFi Access |
15% |
| Social Media |
12% |
| Text |
5% |
| Email |
3% |
3. User Demographics
| Age distribution |
- 18–2415%
- 25–3432%
- 35–4428%
- 45–5416%
- 55+9%
|
| Gender split |
Male 54% / Female 46% |
4. Industry Adoption Rates
| Restaurants & Food |
25% |
| Retail & E-commerce |
20% |
| Real Estate |
15% |
| Healthcare |
12% |
| Education |
10% |
| Events & Tourism |
8% |
| Other |
10% |
5. Performance Metrics
| Avg scan rate by placement |
- Business cards85%
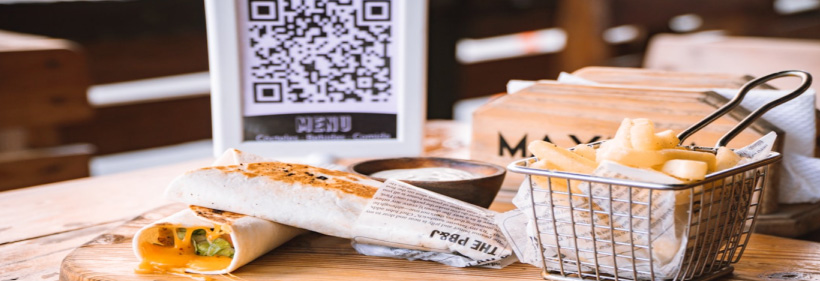
- Restaurant tables70%
- Product packaging45%
- Flyers & posters30%
- Digital ads25%
|
| Scan success rate |
94% successful — 6% failed |
Consumer Behavior Insights
| Scanning motivation |
- Discounts & promotions35%
- Product information25%
- Contact saving15%
- WiFi access12%
- Payment8%
- Entertainment5%
|
| Location preference |
Indoor 65% / Outdoor 35% |
Regional Trends & Future
| Regional adoption growth |
- North America40%
- Europe35%
- Asia-Pacific55%
- Latin America30%
|
| 2025 projections |
Market growth: +45%; new use cases: AR, payments; trend: color & branded QR codes |
Technical Data & Recommendations
| Device compatibility |
iOS 52% / Android 46% / Other 2% |
| App vs native camera |
Built-in camera 88% / Third-party apps 12% |
| Actionable recommendations |
- Optimize for mobile— make landing pages fast & concise
- Time campaigns— use peak hours (lunch/evening)
- Choose right type— vCard for networking, WiFi for hospitality
- Use dynamic codes— for analytics and editability
- Placement— business cards & tables work best
|

